How do I plan a custom media plan with Arkreach?
To plan a custom media list:
- Go to the media planning section via this link: https://app.arkreach.com/media-planning/media-lists/create.
- Fill in the details, including your target media category, geographic targeting, and targeted audience persona.
- Click ‘Save and Create Media List’ to process your media plan, which will be ready for use shortly.
What is Arkreach?
Arkreach is an AI-enabled comprehensive tool focused on readers' news consumption behavioural data, designed to support efficient public relations (PR) research, planning, benchmarking, and measurement. It offers modules for media planning, measurement, comparison, journalist research, and Pulse for AI-curated articles.

Reinvent Your PR Plan: Progressive Metrics and Common Mistakes to Evade
Ready to take your PR game to the next level?
In the ever-changing field of Public Relations, staying ahead is crucial. With the right insights and metrics, you can significantly improve your communication planning and measurement. However, it's important to understand where these metrics come from. For years, most insights were based on output-focused metrics primarily derived from print media.
News consumption behavioral data is revolutionizing PR analytics by focusing on reader behavior in online news outlets. With advanced AI models, Arkreach reveals key trends and insights reflected in the advanced metrics used in our modules.
In this guide, we'll explore some essential progressive metrics to enhance your PR strategy and highlight common pitfalls to avoid.
1. Article-level reach
You'll Gain: The reach of your online article, which refers to the number of people who visited and engaged with your content.
Avoid: Don't use domain traffic data and label it as the article's reach. This is an outdated method!
2. Audience Persona
You'll Gain: A demographic and psychographic profile of the individuals who consumed your article. This is the most effective way to determine if your articles are reaching your intended target audience. If not, consider altering your strategy and use our Media Planning module for precise targeting across 97200 persona segments.
Avoid: There's no need to guess where your target audience gets their news. Trust the data.
3. Share of Voice
You'll Gain: SoV is calculated by the number of people your article reaches within the total category audience size (CAS), i.e., within the sub-segment where the article is hosted (e.g., thehindu.com/health/<your article>; 'health' is the sub-segment that provides the CAS - the maximum number of people your article can reach).
Avoid: Don't use the quantity of published articles as a benchmark for SoV. It might work for print, but for online, it's counterproductive.
4. Media Planning (media list)
You'll Gain: An in-depth look into 27 media categories, enabling you to customize your unique media list based on your targeted audience persona for near real-time data. Dynamic media lists offer predictive reach even before you start your outreach.
Avoid: Avoid using static media lists with monthly domain traffic data as the output for your coverage. Online readers demonstrate dynamic behavior, and the numbers on the media list change almost daily based on your targeted audience set. Stay ahead of the curve!
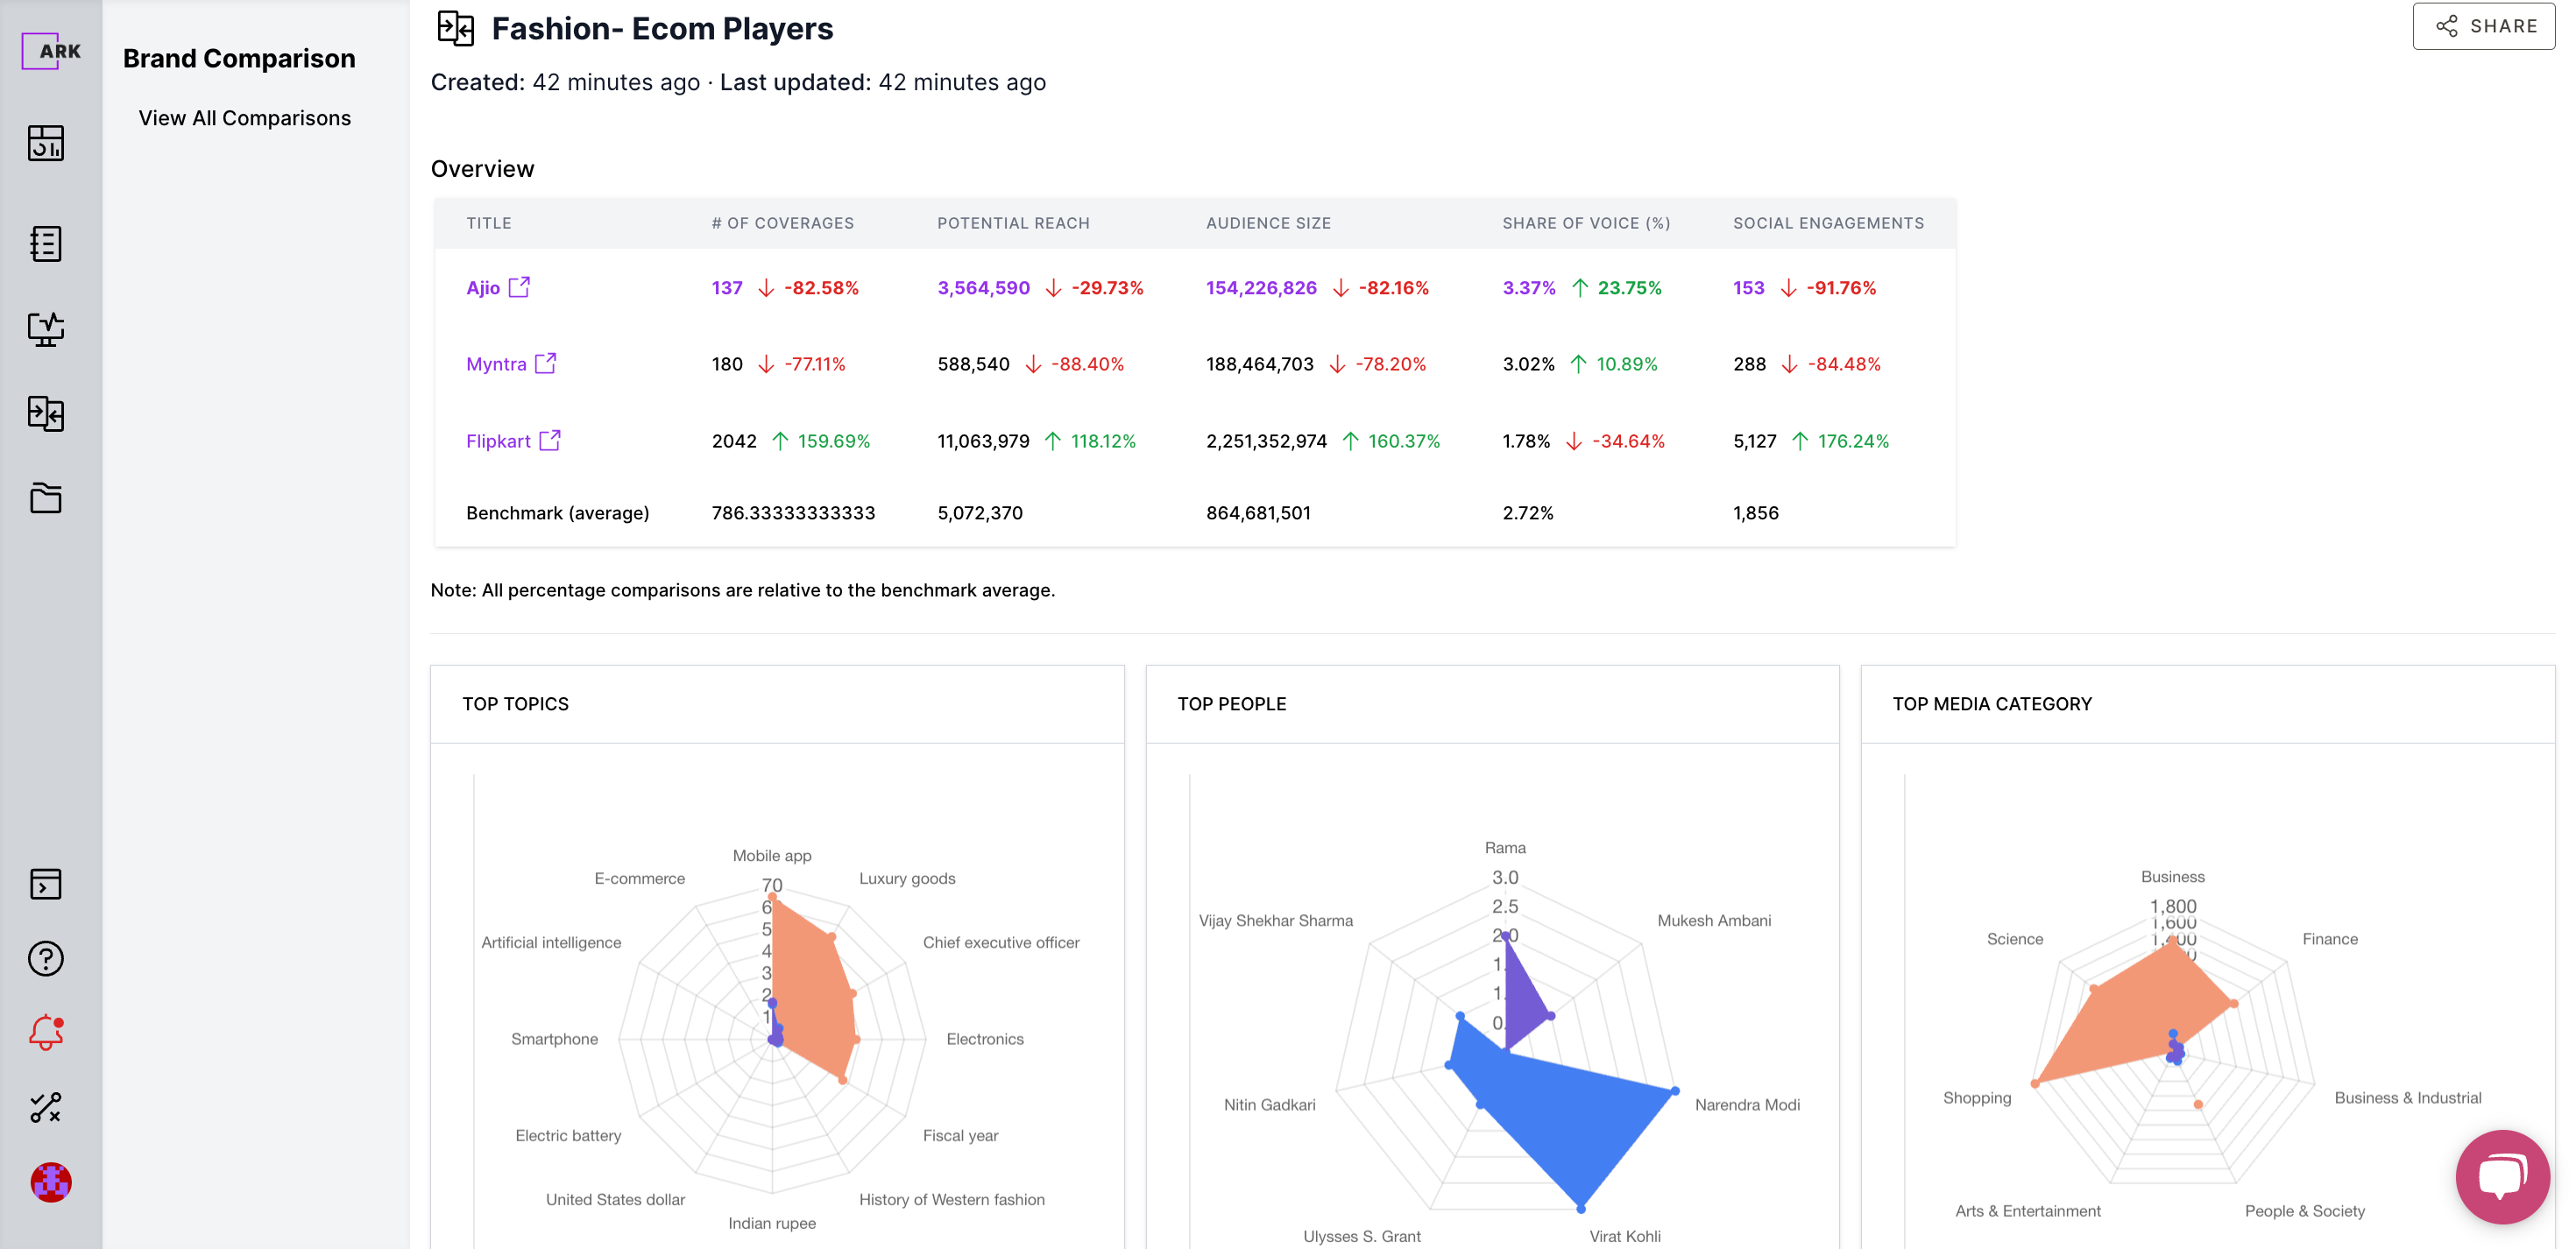
Comparative Measurement Dashboards Now Available!
We are thrilled to bring you the latest product update from Arkreach. We are constantly striving to improve our services and provide you with the most insightful data. In our latest development, we are happy to announce that you can now directly compare various measurement dashboards!
Exploring the New Feature
This new feature allows for a multitude of use cases to better serve your needs:
- You can compare Campaign 1 vs Campaign 2 for your clients or competitors. This function gives you the ability to see how different campaigns stack up against each other.
- You can benchmark two brands against each other, such as Netflix vs Amazon Prime. This comparison can provide valuable insights into industry leaders.
- You can track changes in an industry sector month-on-month. This gives you the ability to keep a pulse on trends and shifts over time.
- You can assess the adverse impact by comparing your brand's media coverage with crisis coverage. This provides a valuable tool in crisis management and mitigation.
How to Use it?
Using this new feature is simple and intuitive:
- Create a Measurement dashboard by either searching or uploading coverage links.
- Select the dashboards you wish to compare.
- Click the 'Compare' button.
- The comparative graphs with benchmark average, top media categories, top people, top topics, audience persona for the coverage, sentiment, languages are now ready. Click 'Download' to get the coverage dump.
Key Takeaways
This new feature allows for a deep-dive into the graphs to assess the media and content strategies. It provides a richer understanding of the landscape and your position within it.
Please note that you can compare a minimum of 2 and a maximum of 4 dashboards at once.
We hope you find this update as exciting as we do. Get started with our new comparative measurement dashboards and let the insights flow!

Analyzing the Poonam Pandey Saga: A Look at Media Impact
In the media world, stories evolve quickly and unexpected narratives can gain significant traction. A recent example of this is the Poonam Pandey saga, which we've examined over 7 days (Feb 1-7, 2024) to understand its impact.
Poonam Pandey, a figure who often finds herself in the media spotlight, recently made headlines once again. This time, it was her connection to the topic of cervical cancer that created a notable surge in news coverage. News articles featuring Poonam Pandey with mentions of cervical cancer saw a significant rise of 42.75%. Without her involvement, standalone articles about her would have only made up 10% of the total coverage.
The rise wasn't limited to articles about Poonam Pandey alone. We noticed a substantial increase in articles about cervical cancer during this period, accounting for 30.7% of the total mix, even without mentioning Pandey. The majority of these articles were in English (96.9%), with a slim 1.4% in Tamil and the rest in other Indian languages.
Interestingly, Nirmala Sitharaman's announcement on vaccination against cervical cancer for girls aged 9 to 14 made up just 15.75% of the unique news articles, excluding those that mentioned Pandey's stunt. The majority of these articles were in English (94.2%) and Hindi (5.7%).
While English is the predominant language for articles about cervical cancer (96% of total articles), the focus on Poonam Pandey led to notable coverage in Bangla, Tamil, and Hindi. However, Kannada, Malayalam, and Gujarati languages did not prominently cover Poonam's story, even though they usually comprise a significant portion of her news articles.
The media coverage around Poonam’s publicity stunt and the focus on cervical cancer achieved a combined reach of 69.83 million online stories. This translated to a 6.71% share of voice based on the unique readers of these news sites. In contrast, the separate announcement about the vaccination by Nirmala Sitharaman reached a further 6.98 million readers, accounting for a 3.55% share of voice.
This analysis provides valuable insights into the dynamics of media coverage, the influence of public figures, and the power of topical issues in shaping the news narrative. It underscores the importance of staying informed about current trends to leverage media attention effectively.
Stay tuned for more deep dives into the media landscape, brought to you by Arkreach.
Arkreach Planning Guide_101
Want to explore how to maximise Arkreach for all your PR planning and strategy needs? Follow these pointers to become a PR professional with an audience-first data planning approach.
Before you begin, try to answer the following questions:
- Identify your target audience. Tip: Consult with your client or make an initial assumption.
- Compile a sample list of news outlets that would ideally suit your target audience.
- Determine the content formats that resonates best with your audience.
- Identify the media category where such content is readily available.
- Note down a few journalists who you would ideally want to approach.
Ready?
Step 1: Navigate to the Media Planning module
- Enter the demographic details of the targeted audience persona, and psychographic details (if available in your subscription plan).
- Select the media category.
- Specify the country for which you want insights.
- Click on 'Create media list'.
Consider these key data points: Ark Score, Predictive Potential Reach, top or niche news outlets, and available Category Audience Size.
Expected Outcomes:
- Determine where your target audiences are in substantial numbers.
- Estimate the potential reach if your content is published on these outlets, given the defined category.
- Use the Ark Score to determine the impact of media outlets for the defined category.
- Identify the journalists with the most significant reach within this media category. (This feature is in the early beta phase.)
Step 2: Navigate to the Measurement Module
- Select the sector or category upon which you'd like to create a dashboard. To create a sector-specific dashboard, add top competitors or the sector name.
- Customize the query. Ensure to add exclusions. For instance, the 'Tech' category could be broad, so eliminate mentions such as mobile phones, IT, etc.
- Choose the language, country, and duration (preferably less than 2 weeks).
- Click 'Create Dashboard'.
Key Data Points to Consider: Share of Voice, Languages, Audience Persona, Sentiment
Expected Outcomes:
- Identify content themes and formats that align with your requirements.
- Determine the audience persona that your content could potentially resonate with.
- Assess the share of voice and Potential reach, i.e., the proportion of the total available category audience size reached by your content. This information will aid you in setting client expectations for the category and adjusting your content strategy as needed.
- Determine the languages in which your campaign will be most effective.
- Investigate sentiment to preempt potential communication pitfalls.
Step 3: Navigate to the Journalist Search module
(Please note, this module is still in the early beta phase. Access may be limited)
- Search for the most impactful categories and identify their top journalists based on article reach.
- Search using category, brand names, keywords, or concepts to find relevant journalists by impact.
- Once you have finalized your list, click on Export.
Next step: You are prepared with everything from data to insights, using progressive metrics for your next PR plan. Let’s go!
Add-on Step 4: Navigate to the Content Optimization module.
(Please note, this module is in its early beta phase and may have limited access)
- Get acquainted with the Optimization module by uploading your release content.
- Enhance the relevance and discoverability of your content by following provided recommendations.
- After achieving a high score for the headline and content body copy, export the content.
Aim:
- Ensure your content achieves the maximum share of voice and visibility.

Arkreach Index: Your Passport to Data Wonderland!
In a world where information is king, Arkreach Index emerges as the wizard behind the curtain, unveiling a realm of data-driven wonders. Let’s embark on a journey into the heart of this innovative platform that promises to reshape the way we navigate insights and correlations across diverse sectors.
Arkreach Index 2024 Unveiled
Picture this: an automated platform fueled by the data prowess of Arkreach, crafting user-friendly indices that read like a roadmap through 27 media categories. Arkreach Index 2024 is not just a tool; it's your passport to a data wonderland!
Whether you're in the tech trenches, the culinary kingdom, or the political playground, Arkreach Index has your back. Dive into sectors spanning health, finance, auto, sports, and more, extracting golden nuggets of insights from 150,000 news sources and 487+ languages.
Arkreach Index doesn't just throw data at you; it’s on a mission. It illuminates perceptions around specific topics for target audiences and also plugs the gaps with tailor-made solutions. It's not just about data; it's about impact.
What's the secret sauce? Tailored data points, handpicked for your brand, leaders, or keywords. This treasure trove is sourced from 150,000 news outlets, covering 97,200 persona segments, 27 media categories, and 487+ languages. It's like having a data genie at your fingertips!
The Index doesn't force you into a data dungeon. Choose your adventure: a user-friendly HTMLized version for a quick spin or a detailed custom report for a deep dive. It’s data at your convenience!
Want a taste of what’s possible? Check out the World Economic Forum - 2024 Index – a detailed journey through online news media's impact, radar charts of associated topics, top leaders, and sentiments. It's like a sneak peek into the data crystal ball.
Here are a few practical ways to use the Arkreach Index:
- Generate FOMO: Spotlight gaps to create urgency among your stakeholders
- Knowledge-Building Initiative: Disseminate reports to keep stakeholders informed.
- Customized Segmentation: Tailor the Index for a personalized approach.
- Lead Generation on Webpage: Attract leads with valuable insights.
- Event/Forum Showcasing: Showcase insights at events for a wider audience.
- Social Media Engagement: Spice up your online presence with content snippets.
- Let’s Dive In!
Explore the Arkreach Index product page here.
Write to us at [email protected] to get started with your custom solution
About Arkreach: Where News Meets AI
Arkreach doesn’t just play in the data sandbox; we redefine the rules. With insights across 10 Indian languages and data from 150,000 sources in 487+ languages, we’re not just where news meets AI – we’re the architects of the meeting room. Welcome to the future!
Social Media Engagements
Social media engagements: You may find this on the measurement dashboard as aggregated data. It is the sum total of social media engagements received on coverage links from Facebook, Twitter, Reddit, and Pinterest.
What is Ark Score?
Ark Score is a universal metric used grade media list-specific sites through precise parameters focused on online user behavior for a particular media list category rather than overall domain traffic size. It is calculated on a scale of 0 to 100, with 100 being the highest value. The score considers various factors such as available content quality, sustained user traffic on specific website sections (not domain), and the targeted audience persona.
One-line definition:
Universal metric out of 100 which grades the media list sites basis the most relevant targeted audience persona consuming the highest category-specific content quality and sustained audience size.
Detailed definition:
Ark score broadly considers the following:
- Content Quality: The Ark Score takes into consideration websites with the most relevant and high-quality media category content. For example, if you choose health or tech as your media category, then the data analyzed will be only for that specific category and not for every other topic in the news domain.
- Sub-section visits: Sustained user traffic on specific website sections where readers spend quality time consuming the category-specific content. For instance, if you want to read about health, you would visit specific sections on the website, such as https://www.nytimes.com/section/health, and other locations where such content is predominantly hosted.
- Audience Persona: A specific audience set chosen basis your targeting criteria and share similar characteristics like location, age, gender, income, occupation, education, household size etc. You can use this to better understand how your targeting selections can limit or expand your targeted audience size. This estimate may vary over time. Tip: You may see improved performance with a broader audience selection.
Why is Arkreach media list different from my usual list?
Well, that's a million-dollar question, since for a long long time media lists for specific media categories have looked the same (with minor changes here and there).
Not saying that our list is the best but it is definitely the only one rooted in news media data and online reader behavior. So, it's definitely worth a try. Let's deep dive and find out why.
The Usual Media List
As the name suggests this is the media list that you have been using currently. What do we know about these lists?
- It is pretty much Influenced by word of mouth i.e. our industry peer discussions on what media outlets work better, where the reputation is great, and what is most loved.
- If a competition gets featured in specific media publications then that definitely got to be on our list.
- That's great but we always need some data as well to layer this up, so here comes the domain traffic i.e. the overall traffic size on a news publication e.g. this would range from a few '000 to million user visits per day on the likes of NYtimes, Economic Times, or The Washington Post ). We used this to measure overall reach, the PR value, and the proverbial ROI.
What's wrong with this approach?
Nothing! it makes sense (kind of) but here's the catch. It lacks one big element and that is DATA.. not just any data but objectively defined DATA focused on actual engagements, not just social media interactions on published news media content.
I know what you are thinking - why not social media interactions?
Social media interactions are the byproduct of your content being published, as and when few (I mean very few) of the readers share it on social media or engage with the article links they find there.
So, what DATA is important for published content on online news media? Here are three good data points that your media list should come true on:
Three good reasons:
Number 1: Who did you reach out to? i.e. Audience persona
Number 2: In what measure were you able to reach out to them? i.e. Potential reach
Number 3: Did the visitors really engage with the article? i.e. Sustained audience size
(sustained audience size: (Definition) Visitors who take more than one action (e.g. click), and spend quality time consuming the content on the site.)
Now, let's see how the Arkreach media list is different.
For starters keep in mind the three good data points we just mentioned.
Now, let's see how Arkreach leverages these.
| Audience Persona | Content Quality | Sustained Audience Size |
These are interconnected aspects through which the Arkreach media list is crafted using its algorithm fuelled by AI models. We solve these by overcoming a series of challenges and here we go...
Challenge number 1: What do we know about the people we want to target?
Using the targeting criteria set we look at news media domains that host visitors with similar characteristics like location, age, gender, income, occupation, education, household size, etc. The focus is to collect information about persona-specific behavior and figure out where they go on the content publishing websites to consumer content.
That brings us to...
Challenge number 2: Where are the most number of people who meet this specific criterion for a particular media category going to read?
....and what do they do there? Well, we know that they consume specific content which can be always categorized among popular themes like health, tech, business etc. This is easy to predict in niche sites but for large news media domains, this becomes a challenge since media category content is contextual and hosted all across the portal.
This brings us to...
Challenge number 3: This is how to isolate this content-specific behavior and start to pick up reader engagement trends.
...and we solve this by focusing on Sustained Audience Size. Most news media websites have loads and loads of visitors but 65% to 85%++ do not stay on the site for long. Either people are either really choosy about what they want to read or they don't like what they see when they land on the news media site. They were possibly misdirected to this web location through online ads, affiliate traffic, or clickbait.
Thus, we focus on quality visitors who take more actions on the news media site and spend some quality time, usually more than 5sec to 10 secs++ (Yep, that's a lot in the lifetime of an online visitor :D)
This brings us to...
Challenge number 4: How do we make sense of all this 'jargon'?
{ ARK score }
Ark Score is a universal metric used to grade media list-specific sites through precise parameters focused on online user behavior for a particular media list category rather than overall domain traffic size. It is calculated on a scale of 0 to 100, with 100 being the highest value. The score considers various factors such as available content quality, sustained user traffic on specific content themes, and the targeted audience persona.
... and that's the reason the Arkreach media list looks different than your usual list.
In summary,
| Reasons to Believe | Usual Media List | Arkreach Media list |
| Reason 1: | Based on overall domain traffic | Based on the most active 'sustained audience size |
| Reason 2: | Doesn't consider the Audience's persona | Focuses on Audience persona |
| Reason 3: | The list is sorted into a niche or general categories | The list is sorted basis of content quality |
| Reason 4: | Doesn't account for dynamic online reader behavior | Focuses on dynamic reader behavior and news cycle. (Read: Ark score) |
| Reason 5: | Takes manual research, and can get quite subjective | DATA doesn't lie. |
While you craft your next media list, and if the numbers start to overwhelm you, remember...
When in doubt trust the Arkscore!
Quick links:
- Website: {Arkreach }
- Dashboard: {login to} start your free trial.
- Blog post on Ark score {here}