Comparative Measurement Dashboards Now Available!
Arkreach introduces a new feature allowing for the direct comparison of various measurement dashboards. The feature supports multiple use cases such as comparing campaigns, benchmarking brands, tracking industry changes, and assessing media coverage in crises. Users can analyze comparative graphs for deeper insight into media and content strategies.
We are thrilled to bring you the latest product update from Arkreach. We are constantly striving to improve our services and provide you with the most insightful data. In our latest development, we are happy to announce that you can now directly compare various measurement dashboards!
Exploring the New Feature
This new feature allows for a multitude of use cases to better serve your needs:
- You can compare Campaign 1 vs Campaign 2 for your clients or competitors. This function gives you the ability to see how different campaigns stack up against each other.
- You can benchmark two brands against each other, such as Netflix vs Amazon Prime. This comparison can provide valuable insights into industry leaders.
- You can track changes in an industry sector month-on-month. This gives you the ability to keep a pulse on trends and shifts over time.
- You can assess the adverse impact by comparing your brand’s media coverage with crisis coverage. This provides a valuable tool in crisis management and mitigation.
How to Use it?
Using this new feature is simple and intuitive:
- Create a Measurement dashboard by either searching or uploading coverage links.
- Select the dashboards you wish to compare.
- Click the ‘Compare’ button.
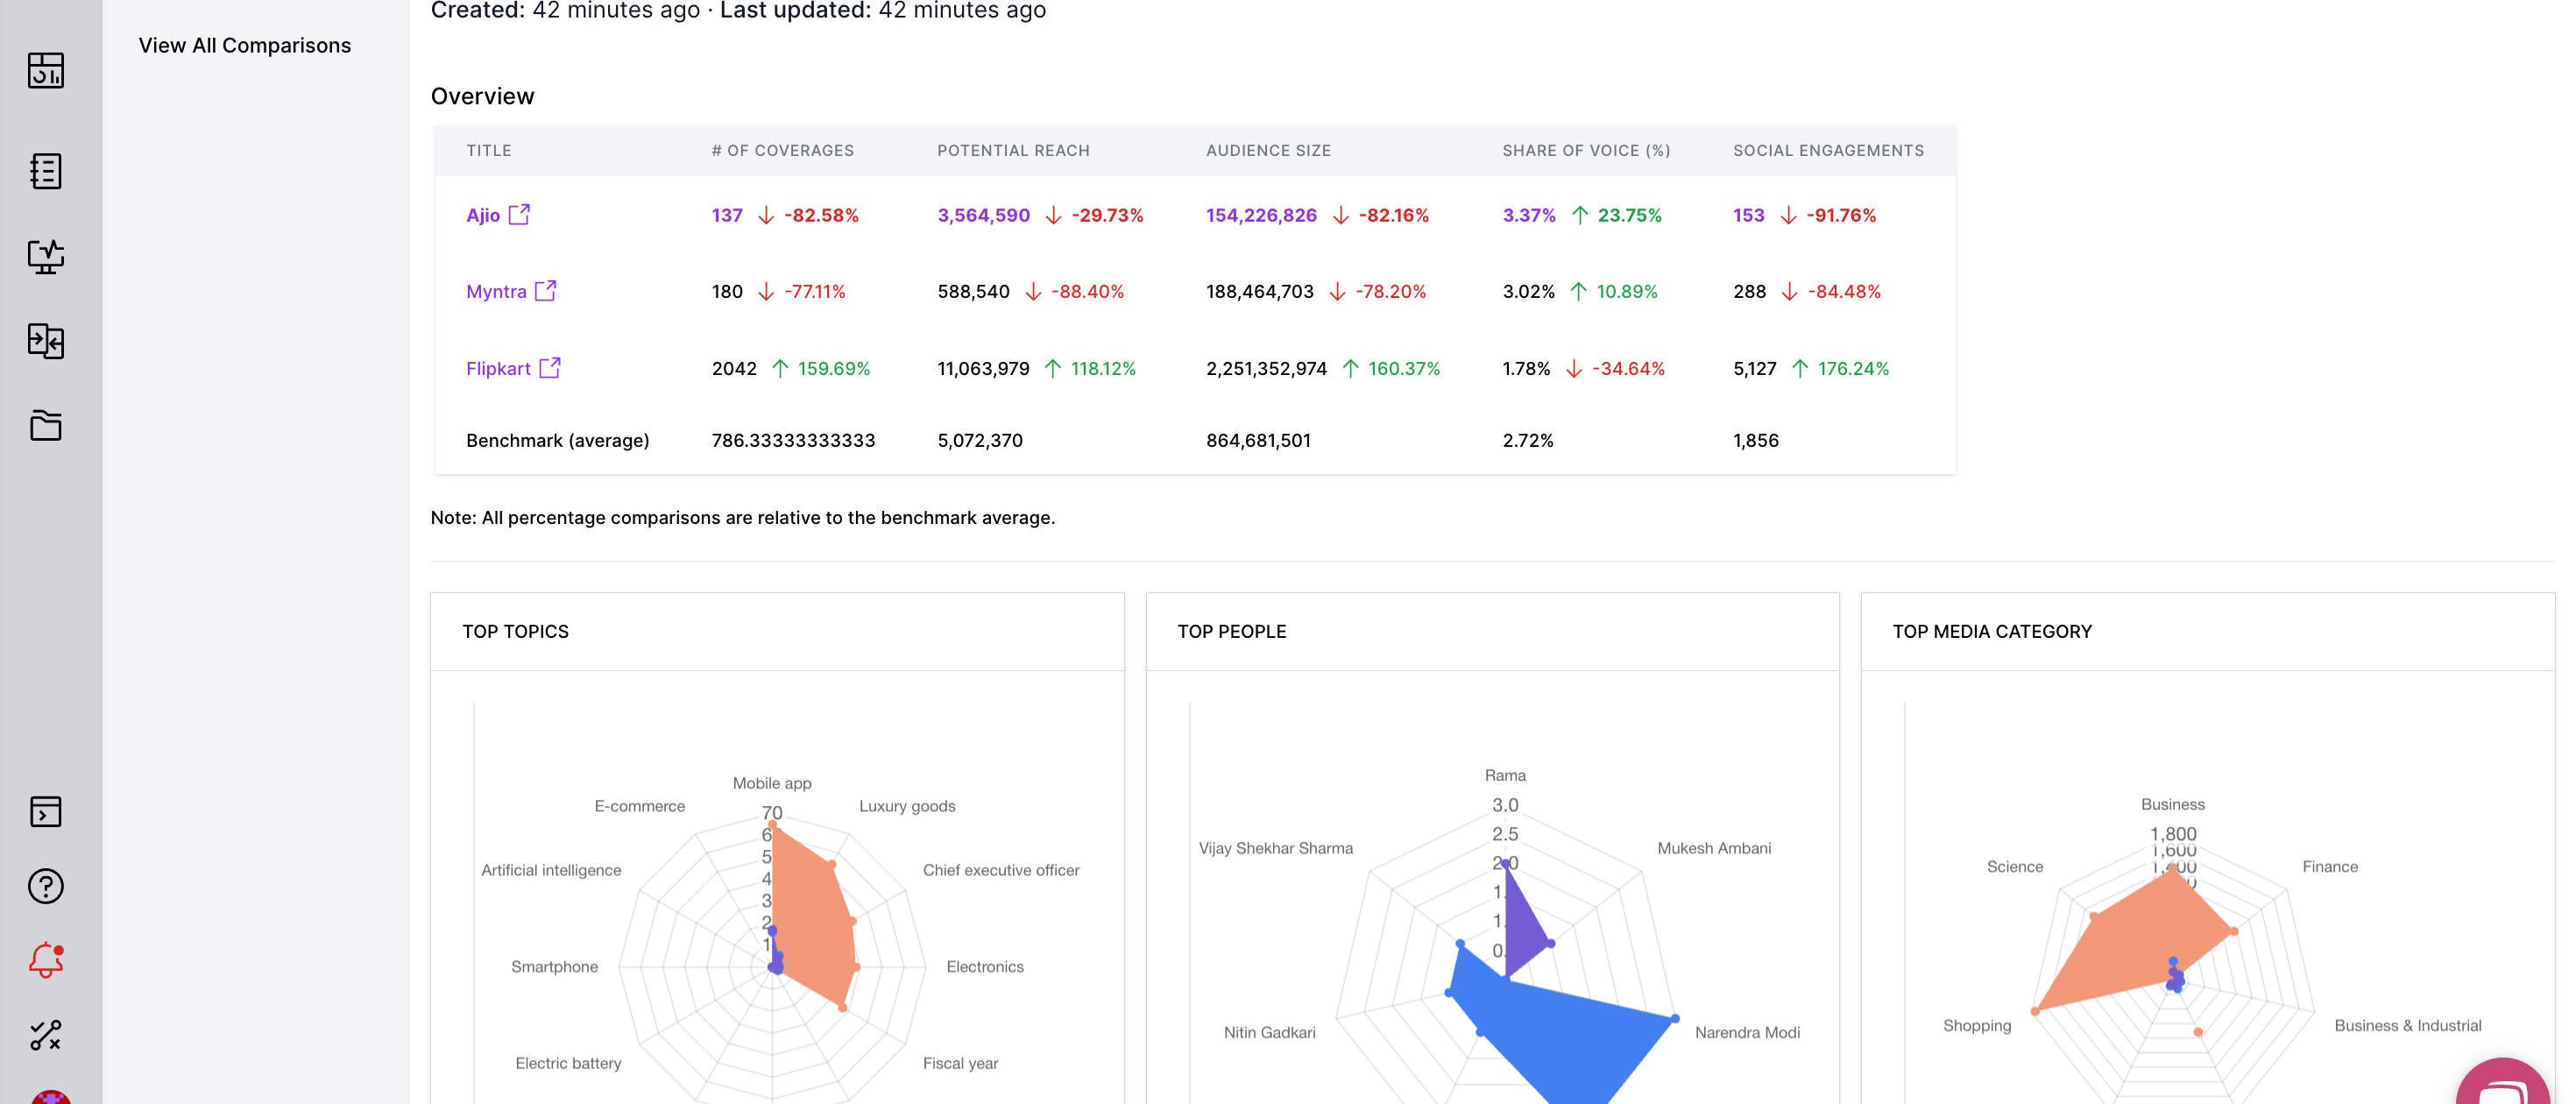
- The comparative graphs with benchmark average, top media categories, top people, top topics, audience persona for the coverage, sentiment, languages are now ready. Click ‘Download’ to get the coverage dump.
Key Takeaways
This new feature allows for a deep-dive into the graphs to assess the media and content strategies. It provides a richer understanding of the landscape and your position within it.
Please note that you can compare a minimum of 2 and a maximum of 4 dashboards at once.
We hope you find this update as exciting as we do. Get started with our new comparative measurement dashboards and let the insights flow!